|
|
|
|
| ʱ�䣺
2008-07-14 17:43:03, ��Դ��δ������ |
| ���⣺
Housing Bubble Correction Update: Fasten your seat belts, here comes the jobs crash |
Source: http://www.itulip.com/forums/showthread.php?p=39709#post39709 by EJ, President, iTulip, Inc
The housing market has fallen hard but it's not time to buy, no matter what you hear. Depending on where you live it's time to decide if you can afford not to sell before prices go lower, or grin and bear it. The choice depends on your likely future employment prospects and where you live.
In our first major update in our series of housing bubble forecasts since 2006 that began with our August 2002 Yes, it's a housing bubble analysis, we delve into the next phase of the housing bubble correction: regional housing price crashes caused by rising unemployment and falling incomes, especially in any state that has a poorly diversified economy not tied to energy or food production. The rate of growth in unemployment in some states may shock you, but our analysis turns up some positive surprises as well.
Professional traders use the phrase "catch a falling knife" to refer to the impulse of the misguided over-eager trader who jumps into a collapsing market to buy what he or she believes are distressed assets only to find that the crash was only starting. Just like the tech stock trader who didn't heed the warnings and bought stocks in December 2000 after the NASDAQ plunged nearly 50% from its 5,049 apex, but before the market collapsed the rest of the way down to 1,172 in 2002, if you buy a home today you can expect significant additional price declines. But you wouldn't know it reading Ben Stein.
In this week's column, the perennial FIRE Economy mouthpiece had this to say about real estate: "The best bet usually is what has gone down the most, and that, for now, is real estate. I got a letter from a thoughtful reader saying he was going to wait until real estate had reached its all time low before he bought. But how will he know? And how rarely does he find a home he truly loves? Even when home buyers buy at the top of the cycle, if they love their homes, and if they can hold on, they always end up delighted.
"Yes, there will be news saying housing will not recover THIS TIME. But in fact, except in really depressed areas, housing recovers EVERY TIME and goes on to pass its prior record. The real story of real estate, as my brilliant money manager friend, Phil DeMuth, says, is of failing to buy, not of staying away successfully.
"The plain fact is that you don't know when real estate will be at bottom until it's too late. If you see a home you love, buy it now if you plan to be in it a long time. And know that the headline writers want to whip you up and make you crazy about the economy. They sell fear. Stay calm and stay well to do."
The key phrase here is the one that Ben throws in to cover his ass should anyone be silly enough to take his advice: "If they can hold on." Back in 2002 when we published "Yes, it's a housing bubble" Ben Stein insisted that no housing bubble existed. At least he's consistent.
Our readers ask, With these huge declines in major housing markets, isn't the worst over? No. All the decline we have seen so far has been the dissipation of asset price inflation created by too much housing credit chasing too few homes between 2002 and 2005. In the manner of all asset price inflations prices will continue to revert to the mean �C then overshoot.
The overshoot in this bubble case will occur as housing prices once again correlate to regional incomes and employment as they have for a century before the housing bubble, except for the post WWII period when pent up demand sent prices reverting to the mean but in an upward direction.
Home prices fall whenever and wherever unemployment is rising and incomes are falling, and now that the recession is starting to produce unemployment, home prices will follow falling incomes down.
If you are in a region that is vulnerable to rising unemployment during this recession it's time to sit down with the calculator or a spread sheet and do an honest analysis of what might happen if you, your husband or wife, or both, lose one or more sources of income. Can you, as Ben says, "hold on"?
 |
Housing bubble review
The trouble with weather forecasting is that it's right too often for us to ignore it and wrong too often for us to rely on it. - Patrick Young
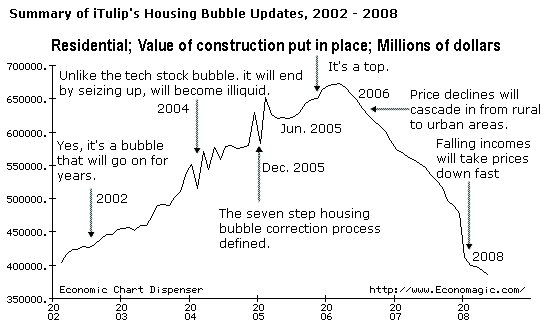
What Young said about weather forecasting applies to economic forecasting in spades. Let's do a quick review of how we got here so you can judge whether you should pay any attention to this analysis, our sixth housing bubble update in four years. To the left is a graph that shows housing market value nationally during the six year 2002 to 2008 period when we provided our previous housing commentaries. Note that value is back where it started in 2002.
Our Housing Bubble Update: Housing Bubbles do not end like stock market bubbles, December 2004 update warned readers that when the housing bubble eventually collapses, the housing market will become illiquid �C sales will stall out and the market will seize up. We didn't want readers to expect that prices were going to collapse as they did in the case of the stock market bubble that we warned them was about to end in March 2000. Unlike housing markets, stock markets are highly liquid. The illiquidity of housing at the start of a market decline drives the psychological dynamics; before home prices can fall first sellers, who expect a return to bubble appreciation rates to which they have become accustomed, wait for the market to "recover." It takes them about a year to figure out that it is not going to, then a bit more time to finally get their heads around the idea that they are going to have to sell at a lower price than they originally thought. Our warning was primarily aimed at investors who could not afford to get stuck with a property, especially poorly capitalized home flippers.
This 2004 forecast was confirmed in 2006 during the early stages of the housing crash as in this Boston Globe story about home sellers coping with a dearth of buyers.
The second update, Housing Bubble Correction Update, Fifteen Years to Revert to the Mean, December 2005, laid out a seven step process, A to G, of the eventual correction. The article was originally posted on the AlwaysOn Network, an outfit based in California. There it was greeted with deep skepticism as hundreds of AlwaysOn members, mostly based in CA, commented that it could never happen. At the height of the housing bubble one out of 100 employed Californians worked in the residential real estate industry �C as a broker, mortgage lender, appraiser, and so on. Home price appreciation peaked in mid 2005 at the time of our "It's a top" update.
We are three years into the housing bubble correction process we defined, at Step D. Step D: Three years into the decline, marginal home buyers will learn what owning a home really costs, versus renting when housing prices are declining and jobs are more scarce. Rent is a fixed cost, whereas home ownership presents many variable costs, including increased interest payments on ARMs, and rising tax, insurance, and energy costs. Also, upkeep for the average home typically costs five to ten percent of the price of the home, annually. As prices fall, homeowners will have less access to home equity loans. Many will not be able to afford repair and maintenance expenses. Homes in some neighborhoods��and in some cases, entire neighborhoods��will begin to look neglected, further depressing prices. Here we underline energy costs in our 2005 forecast because a serious increase in energy prices and its impact on housing prices was not widely expected. We forecast it because we expected ongoing dollar depreciation in the wake of the housing bubble collapse.
The Step D forecast has been confirmed by a number of stories about abandoned and neglected properties, such as the article Atlanta ticketing real estate agents for run-down properties today.
Our third update Dancing, Booze , and Overpriced Housing, June 2005 asserted that the top was in. That forecast was confirmed a year later by home price appreciation data.
The last update Housing Bubble Update: Geographic Regions Cascade, March 2006 explained how asset inflation correction combined with rising fuel prices was due to hit rural areas harder and first before urban areas. This was confirmed by stories like this one about Vermont home buyers avoiding locations that require long commutes. One of our members reported an early instance of the phenomena in High Commuting Costs Push Rural Property Owners Past the Tipping Point, June 2006.
That's the review. What's next?
Next housing bubble correction stage: The jobs crash
On a national scale, housing will continue to decline in line our 2005 forecast for at least another five years, and in some regions prices may not recover for decades. But not all locations will decline as much as others will nor in the same manner. In this update we explain the likely dynamics of regional housing market declines in some detail to help you assets the macro-economic risks to future home values to your state. Note that within states there are always islands of home price appreciation even in the worst of times, such as in Cambridge, Massachusetts or near other areas where high education levels that determine high paying jobs, regionally higher incomes, and good schools support real estate prices.
The latest S&P/Case-Shiller Home Price index tells the national story: massive negative price changes.
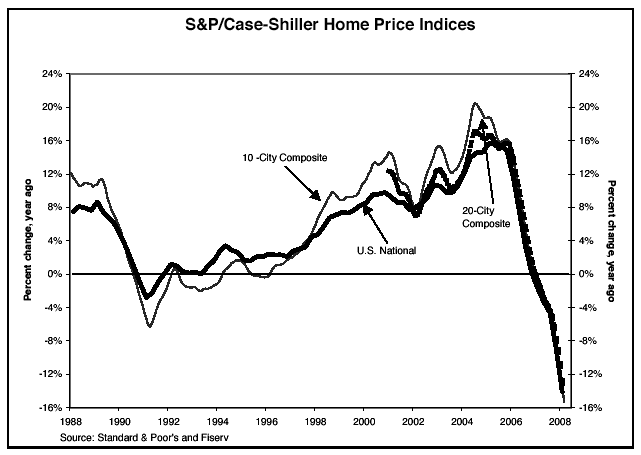 Note: The housing price correction we have seen so far, shown in the chart above, represents only the loss of valuation created by asset price inflation. Falling incomes and rising unemployment will lead the next phase down.
The post housing bubble deflation period is followed by economic contraction and rising unemployment. Falling incomes and rising unemployment will drive housing prices down considerably further.
Why are falling incomes and rising unemployment bad for housing?
This will be self-explanatory for many of our readers, so we'll keep it brief. When incomes fall, borrowers can't make mortgage payments. Even before recession, sub-prime mortgages were sold to households that did not have sufficient income to make payments even when employed full time at their current job. Some were not able to make the first payment. Now that the recession is here, even low credit risk borrowers who were granted Alt-A mortgages face default.
How many? This chart from the New York Fed web site shows, for example, that nearly 25% of all Alt-A mortgage holders in California, one out of four, missed a payment in the last 12 months.
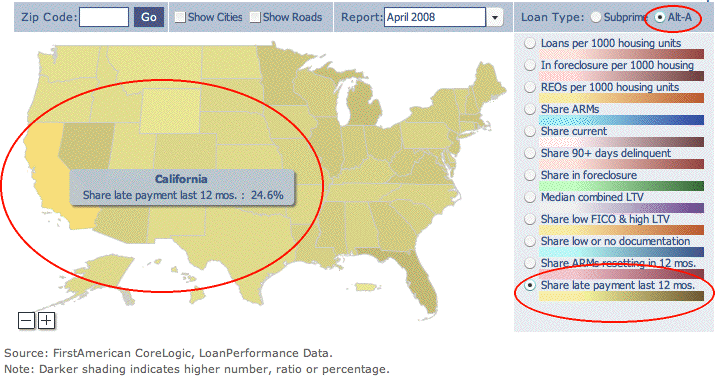
A mortgage holder who misses a payment is technically in default. While few lenders initiate foreclosure until several payments have been missed, the missed payment in last 12 months metric is a good indicator of borrower distress, and it is rising across the nation even before unemployment has increased significantly. The map above is of Alt-A mortgages �C you don't want to see the sub-prime numbers.
Don't let anyone tell you that defaults are limited to mortgages on low cost homes. The map below shows 200 of 629 homes valued at $1,000,000 and up in Orange County, CA that are in foreclosure or are lender owned. Image compliments of CA foreclosure data site ForeclosureRadar.com founded and run by iTulip member Sean O'Toole.
Early innings of future high unemployment
On a national level, unemployment is rising.
ADP shows biggest job loss in nearly 6 years
July 2, 2008 (MarketWatch)
Private-sector firms in the United States lost 79,000 jobs in June, the biggest loss since November 2002, according to the ADP employment index released Wednesday. Employment in the services sector fell by 3,000, the first decline since November 2002. Job gains in May were revised lower to 25,000 from 40,000 earlier. After adding in some 20,000 government jobs that are created in a typical month but not included in ADP's index, the ADP number suggests that about 60,000 nonfarm payroll jobs were lost in June. Economists surveyed by MarketWatch now expect 40,000 net payroll jobs were lost in June, following a loss of 49,000 in May.
The key leading indicator of future unemployment that we have been tracking since 2006 is median duration of unemployment. The reason this measure is important is that long before employers lay off employees and they start to show up in the government payroll employment numbers as unemployed, employers stop hiring and anyone who is unemployed finds a new job harder to locate. Duration of unemployment is the first measure of employment to rise before a recession and the last to fall after a recession ends.
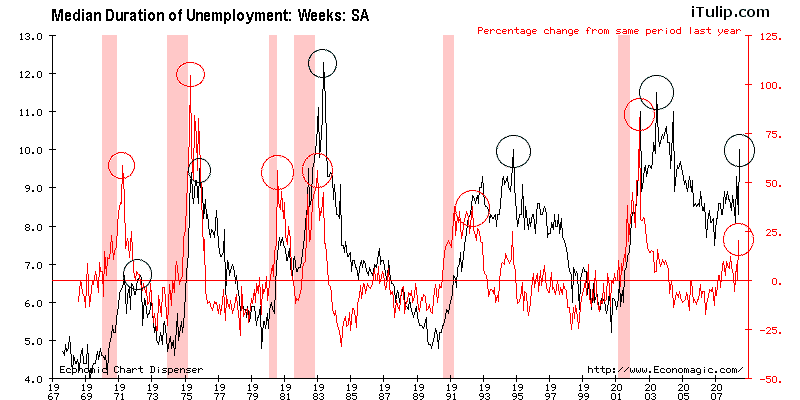 Don't believe the "recovery" nonsense. We are in the early stages of recession. Don't believe the "recovery" nonsense. We are in the early stages of recession.
We expect this recession cycle will create as much unemployment as the 1981 and 2001 recessions. At the start of 2007 we started this cycle with median duration of unemployment at seven weeks and are currently at 10 weeks. We expect duration of unemployment to peak at 13 or 14 weeks, so we are approximately half way through the process. Most of the unemployment rates we are seeing are half what they will be when they finally peak toward the end of 2009 or early 2010.
Three kinds of states: Energy and Food Price Inflation states, Dollar Depreciation states, and Ground Zero states
In the post housing bubble recession, not all housing market declines are created equal. Some markets are crashing while others are merely staggering. While home prices may fall only another 10% or 20% in some areas, in others prices may fall as much as 80% from 2005 peaks.
A small number of states are what we call Energy Price Inflation States. The housing bubble left them mostly untouched and now they are benefiting from high energy and food prices. Examples are Oklahoma and Wyoming. These states are seeing either flat or, in the case of Oklahoma, falling unemployment. Dollar Depreciation States benefit from the boom in manufactured exports and/or tourism created by the weak dollar. European and Asian tourists are flocking to New York City, Boston, and other US cities to enjoy stays at hotels and high end restaurant meals at fire sale prices.
What surprised us as we dug into the state-by-state data, as you will see below, is how rapidly unemployment is rising in a few states that were not housing bubble Ground Zero States.
The most vulnerable regions are those where housing speculation itself was a major driver of incomes and employment during the bubble, such as in Florida, Arizona, and California. The next most vulnerable regions are those with poorly diversified economies, which economies are dependent on industries that are taking the brunt of the recession, like autos, such as Michigan. The least vulnerable are areas where energy plays an important role in the economy, such as Texas.
�� ��Դ��Unknown Friends - δ������ http://us.jiaoyou8.com ��
|
|